IC Markets Home Sign in Web Trader Contact Us
IC Markets Social IC Markets Social

Information Hub for
Serious Traders

  • ABOUT US
  • OPEN LIVE ACCOUNT
  • OPEN DEMO ACCOUNT
  • TRADE NOW
  • VISIT OUR BLOG
IC Markets Social
  • ABOUT US
  • OPEN LIVE ACCOUNT
  • OPEN DEMO ACCOUNT
  • TRADE NOW
  • VISIT OUR BLOG
March 29, 2021North_American_Stocks_ptIC Markets

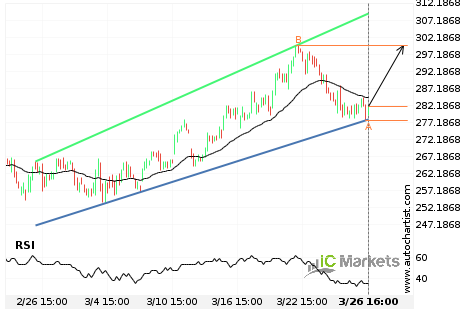
FACEBOOK Nível visado: 299.6400

Canal ascendente identificado em 26-mar-2021 16:00 EDT. Este padrão está ainda em processo de formação. Possível previsão de movimento em alta para o nível de 299.6400 no próximo 2 dias.

Read more
March 26, 2021North_American_Stocks_ptIC Markets

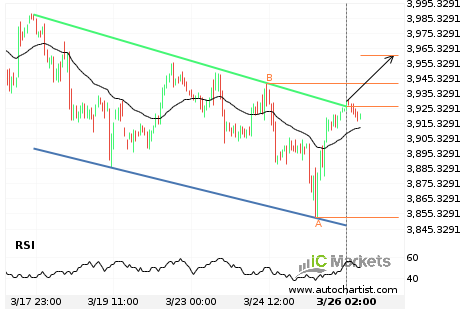
US SPX 500 Index Nível visado: 3960.4769

Canal descendente quebrou na linha de resistência em 26-mar-2021 02:00 EDT. Possível previsão de movimento em alta nos próximos 2 dias para 3960.4769

Read more
March 25, 2021North_American_Stocks_ptIC Markets

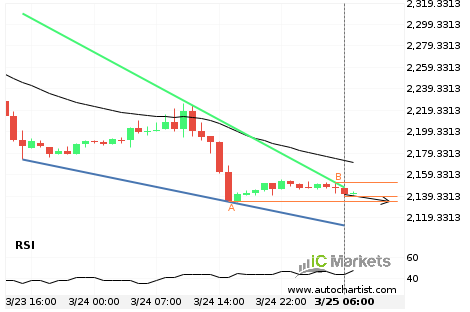
US Small Cap 2000 Index Nível visado: 2134.3400

Cunha descendente identificado em 25-mar-2021 06:00 EDT. Este padrão está ainda em processo de formação. Possível previsão de movimento em baixa para o nível de 2134.3400 no próximo 10 horas.

Read more
March 23, 2021North_American_Stocks_ptIC Markets

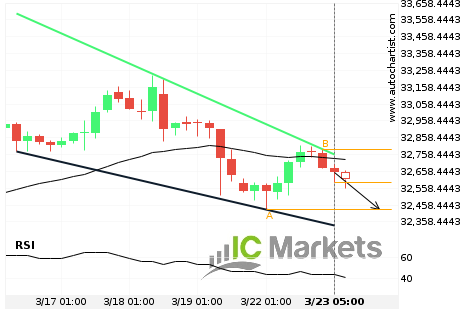
US Wall Street 30 Index Nível visado: 32432.0000

Cunha descendente identificado em 23-mar-2021 05:00 EDT. Este padrão está ainda em processo de formação. Possível previsão de movimento em baixa para o nível de 32432.0000 no próximo dia.

Read more
March 22, 2021North_American_Stocks_ptIC Markets

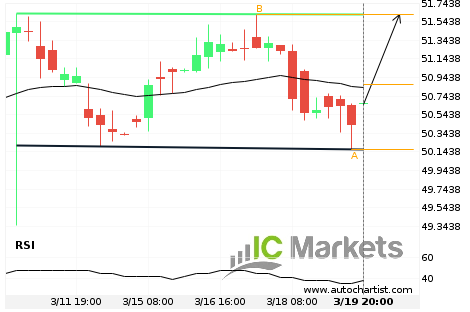
Coca-Cola Co. Nível visado: 51.6200

Rectângulo identificado em 19-mar-2021 20:00 EDT. Este padrão está ainda em processo de formação. Possível previsão de movimento em alta para o nível de 51.6200 no próximo dia.

Read more
March 19, 2021North_American_Stocks_ptIC Markets

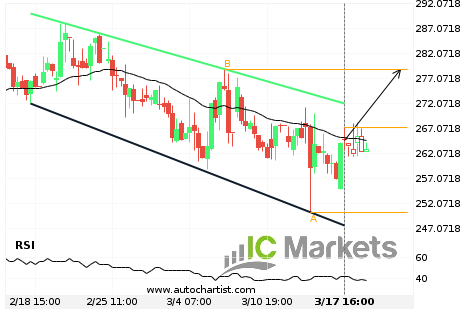
Biogen Idec Inc Nível visado: 278.8700

Canal descendente identificado em 17-mar-2021 16:00 EDT. Este padrão está ainda em processo de formação. Possível previsão de movimento em alta para o nível de 278.8700 no próximo 3 dias.

Read more
March 18, 2021North_American_Stocks_ptIC Markets

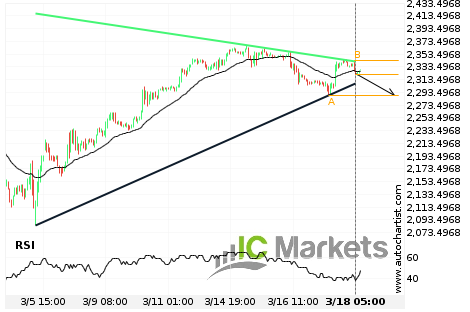
US Small Cap 2000 Index Nível visado: 2288.4400

Triângulo identificado em 18-mar-2021 05:00 EDT. Este padrão está ainda em processo de formação. Possível previsão de movimento em baixa para o nível de 2288.4400 no próximo 3 dias.

Read more
March 17, 2021North_American_Stocks_ptIC Markets

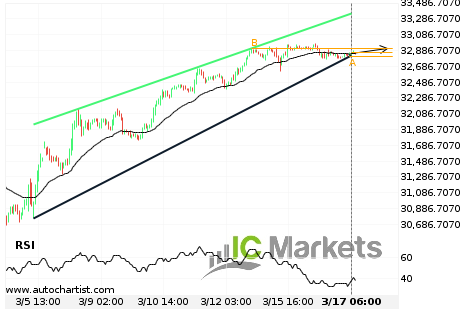
US Wall Street 30 Index Nível visado: 32911.0000

Cunha ascendente identificado em 17-mar-2021 06:00 EDT. Este padrão está ainda em processo de formação. Possível previsão de movimento em alta para o nível de 32911.0000 no próximo 2 dias.

Read more
March 16, 2021North_American_Stocks_ptIC Markets

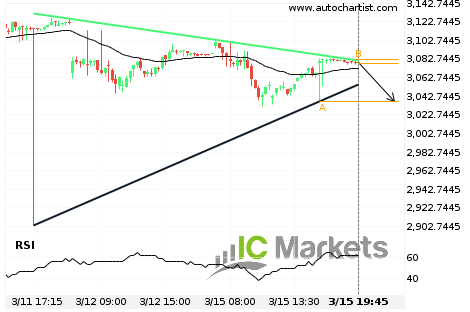
Amazon.Com Inc. Nível visado: 3037.0000

Triângulo identificado em 15-mar-2021 19:45 EDT. Este padrão está ainda em processo de formação. Possível previsão de movimento em baixa para o nível de 3037.0000 no próximo 8 horas.

Read more
March 15, 2021North_American_Stocks_ptIC Markets

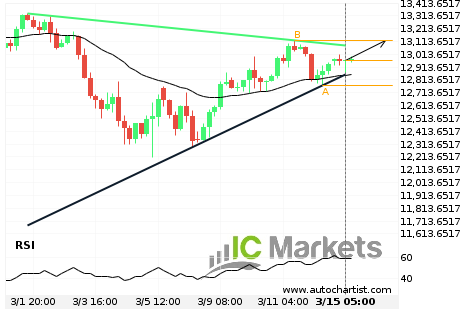
US Tech 100 Index Nível visado: 13119.6000

Triângulo identificado em 15-mar-2021 05:00 EDT. Este padrão está ainda em processo de formação. Possível previsão de movimento em alta para o nível de 13119.6000 no próximo 3 dias.

Read more
  • 1
  • 2
  • 3
  • …
  • 84
  • 85
  • 86
  • 87
  • 88
  • 89

Recent Posts

  • Either a rebound or a breakout imminent on SILVER
  • GOLD Nível visado: 2976.3601
  • A potential bearish movement on GOLD
  • มีโอกาสเกิดการเคลื่อนตัวแบบ bearish บน GOLD
  • Posible gran movimiento en el AUDJPY

Recent Comments

    Translation


     Edit Translation

    Trade with

    a market leader you can rely on

    Open Trading Account Try a Free Demo

    Forex Trading

    • Accounts Overview
    • Open an Account
    • Launch Web Trader

    Trading Specifications

    • Spreads and Commissions
    • Range of Market
    • Trading Hours
    • Funding
    • Withdrawal

    About IC Markets

    • Help Center
    • Why IC Markets
    • Regulation
    • Legal Documents
    • Contact Us


    Forex Trading

    • Accounts Overview
    • Open an Account
    • Launch Web Trader

    Trading Specifications

    • Spreads and Commissions
    • Range of Market
    • Trading Hours
    • Funding
    • Withdrawal

    About IC Markets

    • Chat with a Specialist 24/7
    • Why IC Markets
    • Regulation
    • Legal Documents
    • Contact Us

    Disclaimer: This material is marketing material where all marketing material is published for informational purposes only. This material does not contain and should not be considered as containing - investment advice and recommendations, or suggestions for performing any actions with financial instruments. The built-in widgets belong to their external independent authors, and IC Markets is not responsible for their content and their impact on trade.

    All content rights reserved. Opinions of the authors may not coincide with the opinion of the blog editors. When copying materials from this site or connecting to an RSS feed to republish our articles, a link to IC Markets or attribution in the format ‘IC Markets Blog’ is required. For general questions, please contact the editorial office via the form on the Contact us page.

    Risk Warning: Trading Derivatives carries a high level of risk to your capital and you should only trade with money you can afford to lose. Trading Derivatives may not be suitable for all investors, so please ensure that you fully understand the risks involved and seek independent advice if necessary. A Product Disclosure Statement (PDS) should be considered before entering into a transaction with us.

    The contents of this page are general information only and does not take into account your personal situation, financial objectives or needs. It is up to you to make sure the products that we offer suit your specific needs. You should not trade with us unless you understand the features and risks of the products that we offer. This means that you might need to seek independent advice before you start trading with us.

    © 2022 Raw Trading Ltd | All rights reserved.
    • Sample Page